GrowSpace
Production · Inventory · Warehouse · Equipment — Site Operations System

Running Your Factory
on Excel and KakaoTalk?

Stop hunting down whoever's in charge just to check production status or inventory counts. After a consultation, we build only what fits your site — nothing more.

Get an Operations Diagnosis
Proven on Large Enterprise Sites·We Help You Check Government Grant Eligibility·Smart Factory Subsidy Guidance·We reply within 1 business day
Works With Your Existing Systems  UWB Real-Time Positioning · RFID Asset Tracking · Outdoor GPS-RTK · Existing ERP/MES Integration
Grant Matching · Planning Support

As of H1 2026, 9 out of 10 government grant applications we supported were selected

We support you from product planning through grant matching and proposal writing. You can consult with us even before you have a budget.

Ask About Grant Support
WHAT WE BUILD

Looking for one of these?

You only need one of the items below. Instead of buying an entire all-in-one system, we start by building the one thing that's causing you the most pain right now.

Inventory & Stock Movement Warehouse & Logistics (WMS) Production & Process Control (MES) Equipment & Maintenance History Materials & Purchase Order Management Multi-Site Unified View

We migrate the Excel templates you already use, as-is. Your team won't have to learn a new interface from scratch, and if needed, we can add AI-based demand forecasting or anomaly detection on top.

CASES

What We've Actually Built

Instead of a technology pitch, here are the actual projects we've delivered. See the situation, what we built, and exactly how it changed the person's day-to-day work.

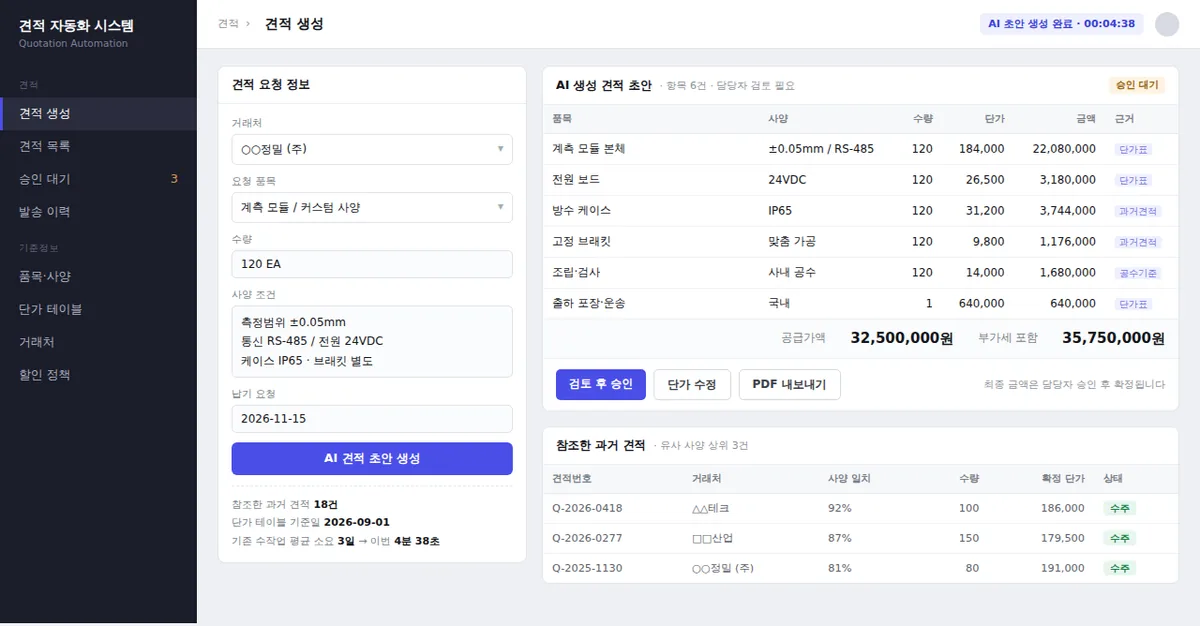
Example AI quote generation screen - quote request details, the auto-generated draft, and the list of referenced past quotes
Instrumentation & Equipment Manufacturing

One Quote Used to Take 3 Days — Now an AI Draft Takes 5 Minutes

Situation
Every order had different specs, so staff wrote each quote from scratch. Manually matching price lists and past quotes usually took 3 days per quote.
What We Built
A quoting automation tool that drafts a quote from past quotes and pricing data, which staff then review and approve.
How It Works
Enter Specs → Match Similar Past Quotes → Apply Pricing → Generate Draft → Staff Approval → Send PDF
Result
A draft is ready in 5 minutes. Since staff must approve the final price, review responsibility stays exactly where it was.

Scope of Work — Software Development · Pricing/Quote Data Organization · Approval Workflow · PDF Output
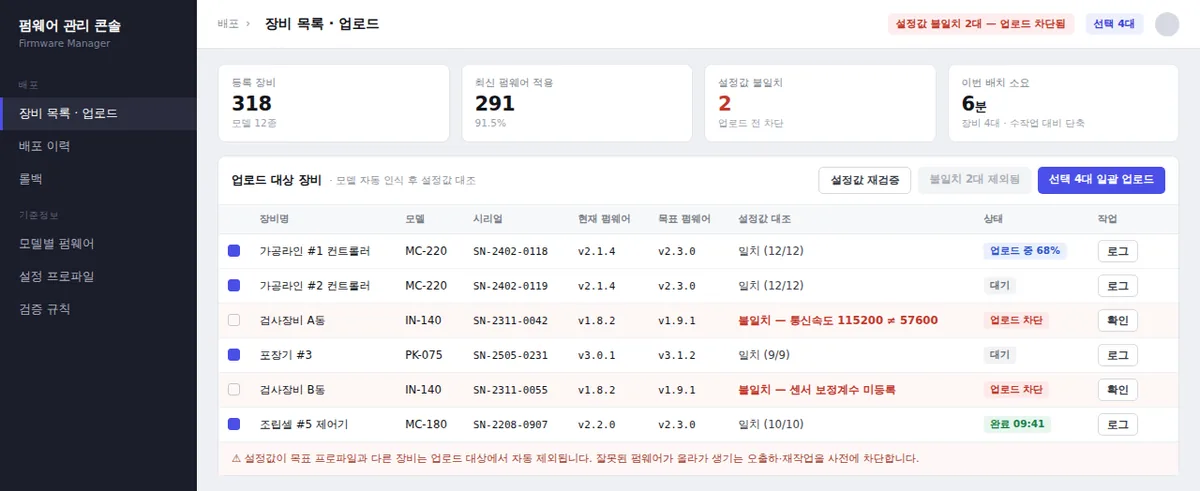
Example firmware management console screen - current vs. target firmware per device, settings comparison results, and blocked-upload status
Equipment Manufacturing

Firmware Differed by Model — Manual Uploads, Now Automated

Situation
Firmware and settings varied by equipment model and serial number, so staff checked and uploaded each one by hand. A mistake meant rework or shipping the wrong configuration.
What We Built
A management console that recognizes each device, automatically checks it against the target firmware/settings profile, and batch-uploads only the matching devices.
How It Works
Detect Device → Compare Current vs. Target Values → Block Mismatched Devices → Batch Upload → Log History
Result
Devices with mismatched settings are automatically excluded from the upload. This closes off the path for incorrect firmware to be installed at all.

Scope of Work — Software Development · Device Communication Integration · Validation Rules · Deployment History & Rollback

Screen Example
Data ›Place List · Map3 Pending Review12 Updated Today
Registered Places2,2676 Categories
Published2,18096.2%
Pending Review3Needs Review Before Publishing
Department Responsible for Updates9Direct Edits by Department
Place List · Map— Consolidates Each Department's Data Into One Place, Organized by Coordinates
Central Lake Park
City Art Museum
Local History Museum
Observation Deck
Transit Parking
Autumn Festival Grounds
Public Parking Lot 3
City Art Museum
Category
Cultural Facility
Coordinates
35.1602, 129.0421
Owner
Culture & Arts Dept.
Last Updated
2 days ago
AttractionCultural FacilityEventParking
1 : 5,000
Place NameCategoryDepartmentPublished
City Art MuseumCultural FacilityCulture & Arts Dept.Published
Central Lake ParkAttractionParks & Green Space Dept.Published
Autumn Festival GroundsEventTourism Promotion Dept.Pending Review
Public Parking Lot 3ParkingTransportation Dept.Published
Local History MuseumCultural FacilityCulture & Arts Dept.Published
Transit ParkingParkingTransportation Dept.Pending Review
Trail Information CenterAttractionParks & Green Space Dept.Unpublished

When department staff register or edit entries directly, the map and public guide screen update immediately. Entries with missing or duplicate coordinates are automatically excluded from publishing.

Public Sector & Local Government

Data Scattered Across Departments, Unified Into One Map

Situation
Attraction, facility, and event information was scattered across each department's own documents and sites, leaving residents and visitors with no single place to find it all.
What We Built
A service that consolidates and cleans up scattered data, then makes it searchable and browsable on a single map.
How It Works
Data Collection & Cleanup → Map Mapping → Search & Guidance → Operations & Update Console
Result
Departments update their own data directly, and users find everything in one screen.

Scope of Work — Data Cleanup · Map Service Development · Operations Console

Screen Example
Control ›Live Status1 Restricted Zone Entry214 Tracked
Tracked21496 Workers · 118 Equipment
Receiving Normally20997.7%
Zone Events (Today)374 Restricted Zones · 33 Deviations
Sent to Existing System99.8%Last 24 Hours
Site Floor Plan · Live Location— Turns Location and Events Into Data, Delivered to Your Existing System
A · Assembly Zone
C · Restricted Zone
B · Staging for Shipment
D · Material Storage
Worker W-118
Forklift F-07
Worker W-042 · Restricted Zone
Transport Cart T-11
Pallet P-2210
Crane C-03
Access Gate
NormalAlertStandbyFixed Equipment
Updated Every 1s · 09:41:26
EventsLast 6
W-042 Entered Restricted Zone C
09:41:02 · Manager Alert Sent
Alert
F-07 Deviated From Designated Route
09:38:47 · Assembly Zone A
Caution
P-2210 Entered Shipping Staging Zone
09:36:11 · Sent to MES
Sent
C-03 Work Start Logged
09:31:55 · Sent to ERP
Sent
W-118 Passed Access Gate
09:28:03 · Reflected in Attendance Record
Normal
209 Night-Shift Devices Receiving Normally
09:00:00 · Daily Check
Normal

⚠ Entering a restricted zone triggers an immediate alert, and the same event is sent to your existing ERP/MES in a defined format. Because location history is logged, you can trace back exactly what happened at any point in time.

Logistics · Construction · Manufacturing

We Turned People and Equipment Locations Into Data, Fed Into Your Existing System

Situation
Vehicle, asset, and worker locations existed only in people's eyes and handwritten logs — finding anything took time, and nothing was ever recorded.
What We Built
We install positioning hardware on-site to generate location and event data, then deliver that data to your existing ERP/MES.
How It Works
Install Site Hardware → Generate Location/Event Data → Control Dashboard → Integrate With Existing Systems
Result
Currently running at automotive logistics, large-scale construction, and steel manufacturing sites. Unlike vendors who only do software, one team handles everything starting from the hardware.

Scope of Work — Hardware Installation · Real-Time Positioning · Control Dashboard · Existing System Integration

Get a Scope & Quote Based on Your SiteWe reply within 1 business day · Consultation is free

※ The screens above are example views showing the actual functionality of software we built, and do not contain any real customer data. Some customer names cannot be disclosed under contract, so they are labeled by industry only.

Actual Screens

Instead of Just Describing It, We Show You the Actual Screens We Built

Here's what the projects above actually look like in practice. The screens below are ones we designed, built, and currently operate ourselves — for your project, we build them fresh around your process, zones, and terminology.

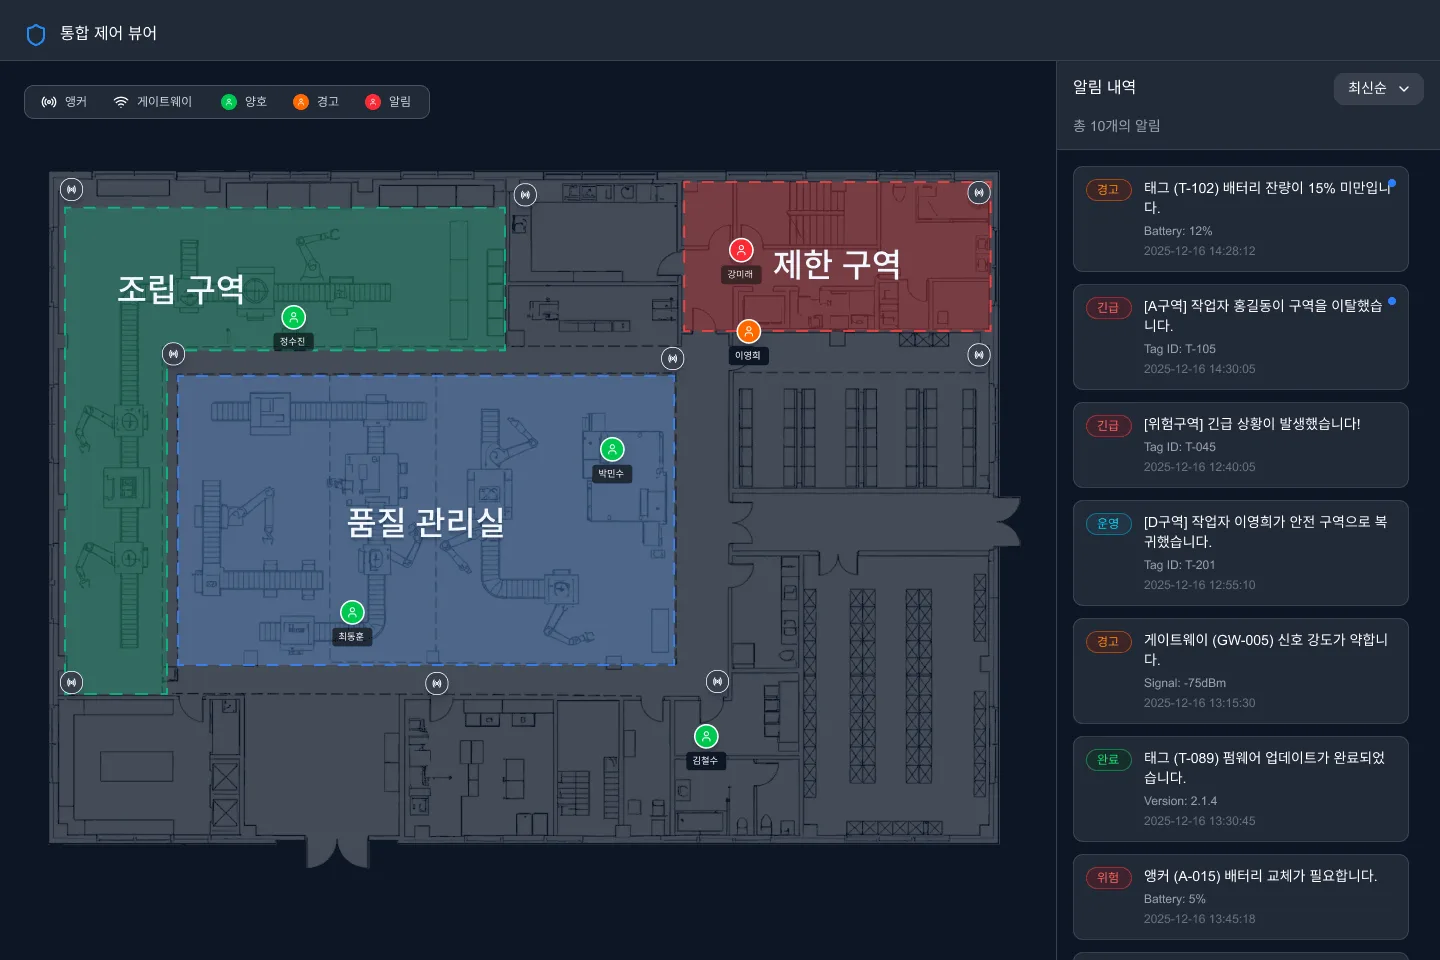
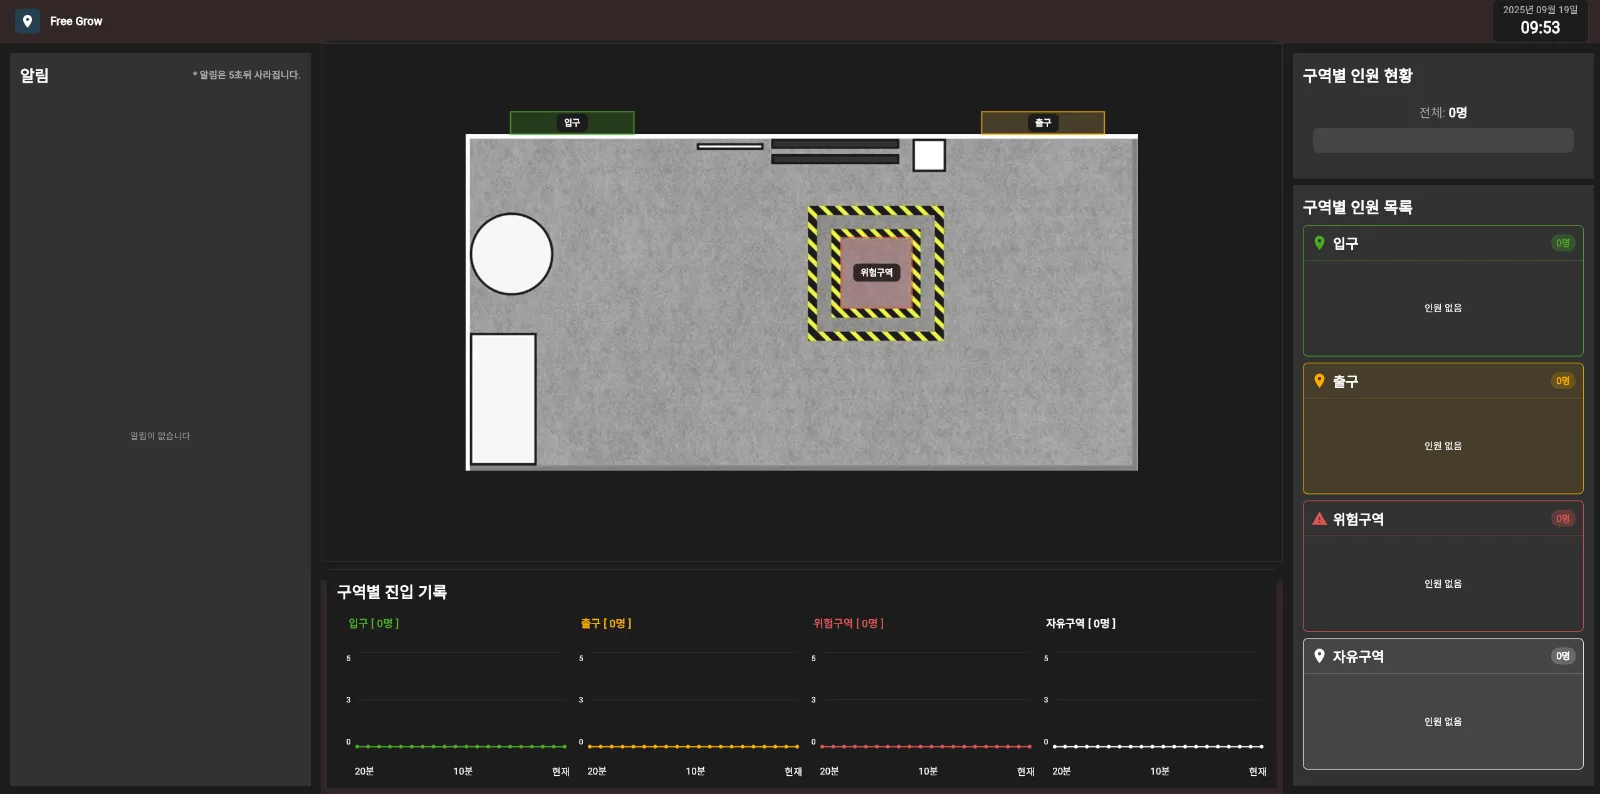
GrowSpace control dashboard — per-zone personnel status screen
Site Operations ScreenZones are overlaid on the site floor plan, so status and alerts for each zone appear on one screen. We keep the interface simple so managers don't need separate training.
GrowSpace unified control view — zone settings and alert history screen
Unified Control ScreenOperators can change zone definitions, status colors, and alert history themselves. You won't need to call us every time conditions change.

The screens above are product screens we built and currently operate. They do not contain any real customer data.

ONE TEAM, END TO END
Software · Hardware · Integration · Operations
GrowSpace One Team, End to End

Unlike vendors who only build software, one team carries everything through in a single flow — from installing positioning hardware, to integration, to ongoing operations.

FOR YOUR SITE

Is This Your Site?

If any of these sound like your situation, it's time to start with a diagnosis.

Manufacturing

Multiple lines and processes, with no real-time view of progress

Warehousing

Inventory location and count keep drifting from the ledger

Equipment-Heavy Sites

Inspection and maintenance history scattered across memory and notebooks

Multi-Site Operators

Can't view multiple sites in a single screen

PROBLEM → SOLUTION

The problem is clear. So is the solution.

Here's what you're dealing with now, side by side with what changes.

×You find out production status only after you've clocked out
Real-Time Production Monitoring
×Inventory never matches the ledger
Real-Time Inventory Management
×Equipment inspection history is scattered everywhere
Unified Maintenance History
×Off-the-shelf systems don't fit our process
Custom-Fit Modules After Consulting
WHAT "CUSTOM-FIT" MEANS

'Custom-Fit' Doesn't Mean Expensive or Slow

We don't build from scratch. On top of already-proven modules, consulting adjusts only your process, forms, and integrations to fit.

Proven Modules
Production Status · Inventory · Equipment History · Dashboards · Reports
+
Consulting Fit
Adjusts Only Your Process, Forms, and Integrations
=
Fast and Reasonably Priced
Faster Than Off-the-Shelf SI, Cheaper Than Full Custom Build
INTEGRATIONS

We Don't Just Hand Over Software — We Install the Site Hardware Too

We generate site data with hardware we built ourselves, then deliver that data into the systems you already use.

1Hardware GrowSpace Installs Directly On-Site

UWB Real-Time Positioning

Indoor location of people, forklifts, and assets (centimeter-level)

RFID Asset & Event Recognition

Automatically logs inbound/outbound and asset flow (no manual entry)

Outdoor GPS-RTK

Seamless positioning that extends to yards and outdoor areas

Site Hardware Location & Event Data Existing ERP/MES

We take the location and event data we generate and send it automatically(export).

2Connect Data to the Systems You Already Use

Existing ERP/MES

Automatically Sends the Location & Event Data We Generate (Export)

Devices We Build Ourselves

If You Need a Device, We Handle That Too, Start to Finish

We don't just hand over software and leave you to source the hardware yourself. For any device your site needs, we handle everything — from finalizing specs, to manufacturing and installation, to ongoing operation.

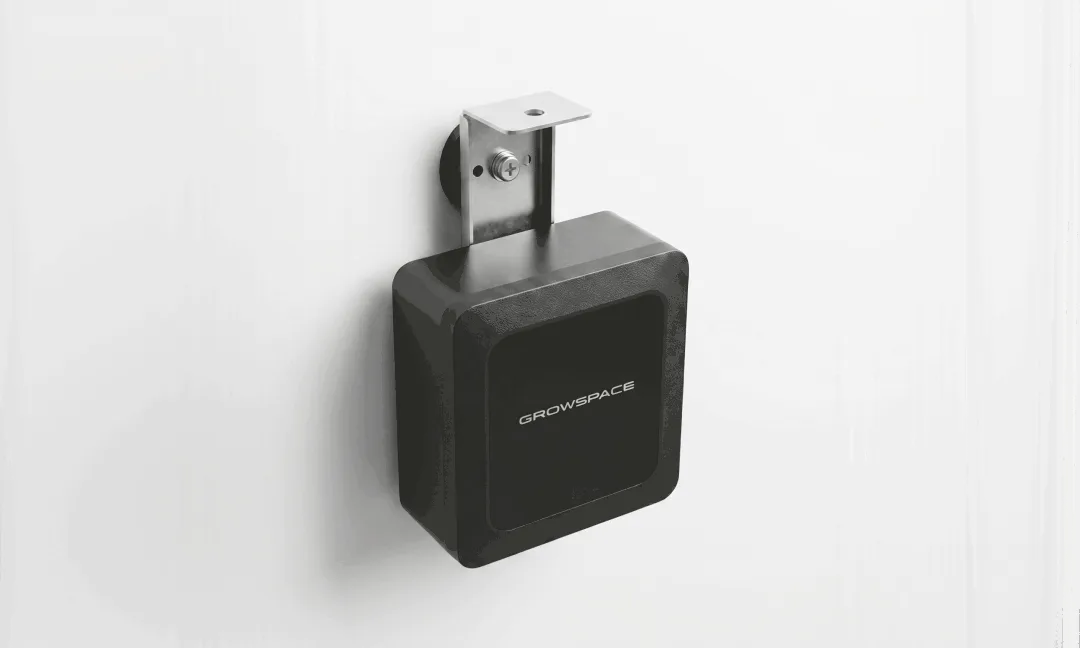
GrowSpace gateway — an on-site installation device designed and manufactured in-house
On-Site Installation DevicesWe custom-build brackets and enclosures to match the mounting location — ceiling, wall, column, or otherwise. Power and communication methods are also matched to what actually works at that site.

The device above is one we specified, manufactured, and installed ourselves, and it is currently in operation.

INTEGRATION

Can it integrate with the control system, MES, or WMS we already use?

Yes. We don't rip out the systems you're already using.

This is the first question most people ask. The default approach keeps your existing screens exactly as they are, and simply feeds the data we generate into them. We can also do the reverse — pulling your existing data onto our map. Which direction makes sense depends on the systems your site is already running.

Direction ①

Our Data → Your Existing System

We export location, access, and operation logs in the format your existing MES, ERP, or WMS expects — via REST API, direct database load, or batch file, whichever your system can receive.

Direction ②

Your Existing Data → Onto Our Map

We pull in data you already have — equipment status, work orders, inventory location — and display it directly on your site floor plan. What used to be just numbers becomes something you see in place.

Direction ③

Just Add One More Screen

You can also add just a map view, without replacing any system. Start by putting it up on one monitor in the control room, then expand the integration later if you need to.

If All You Get Is Hardware, Nothing on Site Actually Changes

Even after sensors and hardware are installed, your site only starts to change once that data is visible on a screen. That's why we don't stop at delivering hardware — we build the screens too. One team handles everything from registering your floor plan to integrating with your existing systems.

STEP 01

Register Your Floor Plan

Upload the floor plan you already use and divide it into floors and zones.

STEP 02

Display It on Top

See where people, equipment, and vehicles are right now, on the floor plan.

STEP 03

Connect to Your Existing Systems

We connect the data through to the control system, MES, or ERP you already use.

Proof of Integration

We Don't Just Say "It Integrates" — We Also Hand Over the Documentation and Admin Screens

Integrating with your existing MES, ERP, or control system ultimately requires documentation of who exchanges data with whom, and in what format. We build and hand over both the integration API documentation and a data management screen.

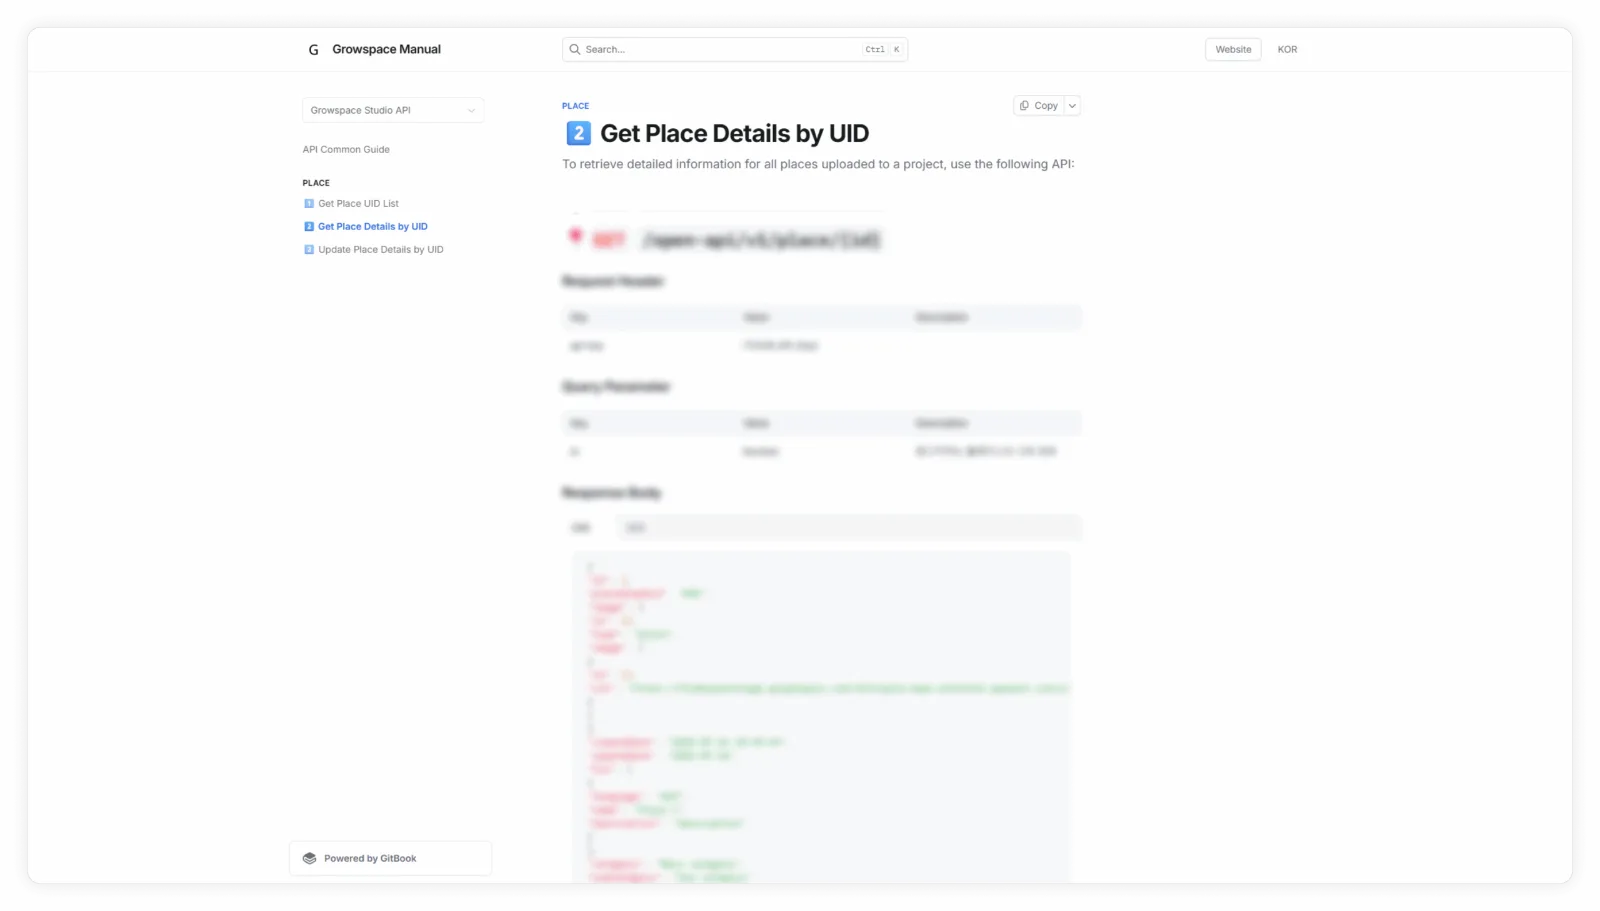
GrowSpace API manual screen — API documentation for external system integration
Integration API DocumentationWe document request/response formats and parameters field by field, so your in-house development team or existing SI vendor can pick it up and integrate directly.
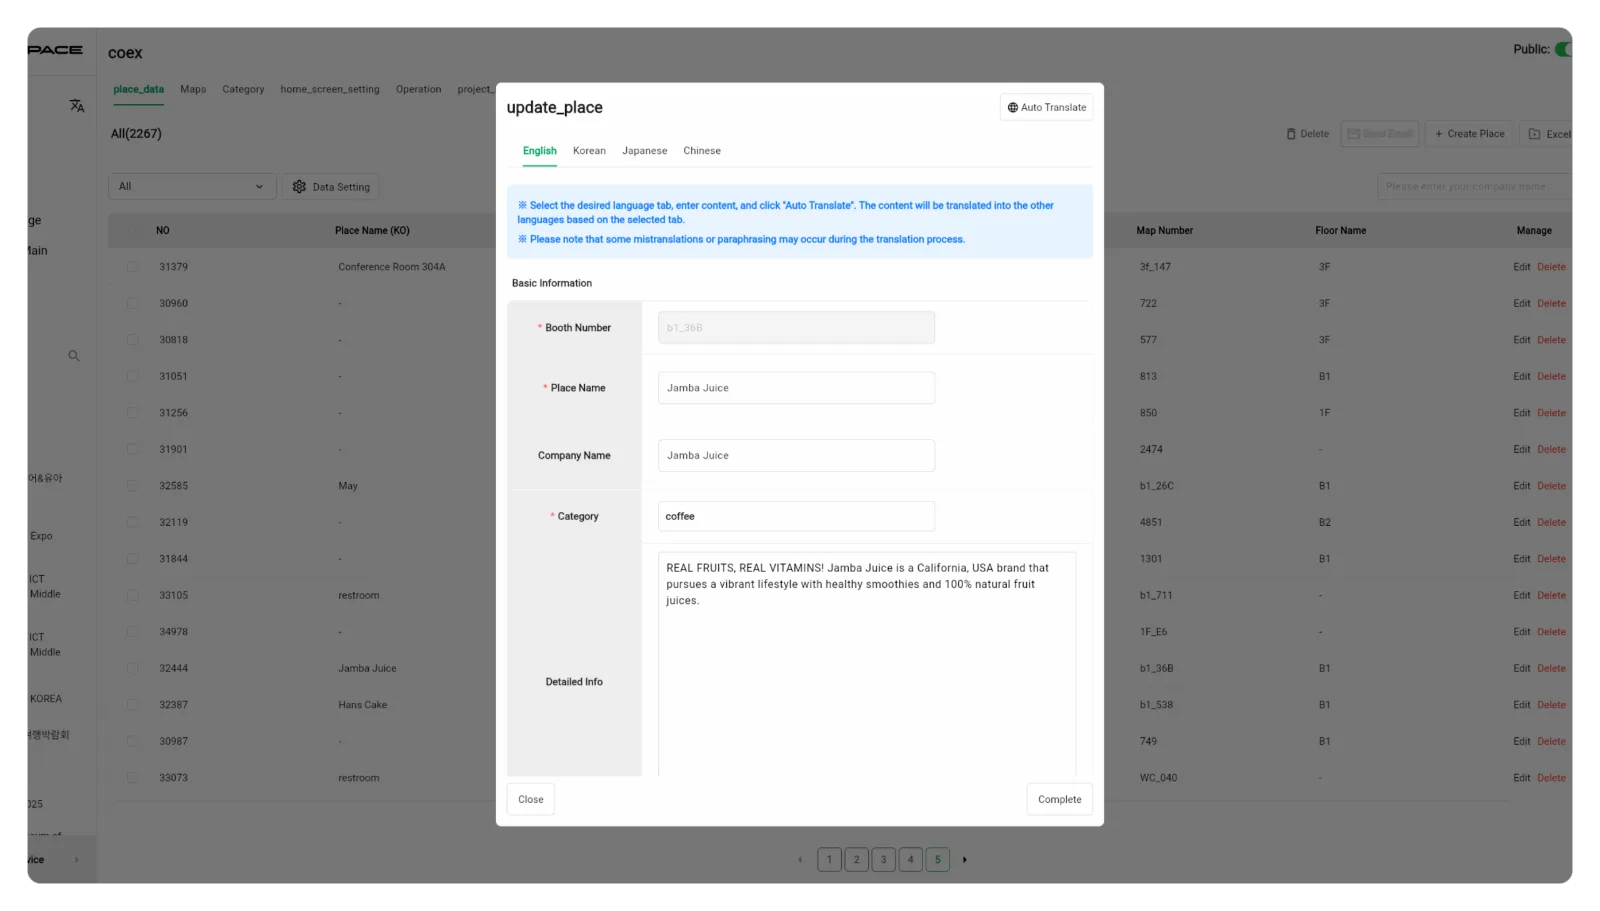
GrowSpace admin screen — bulk space data management and multi-language conversion
Data Management ScreenManage space and location data as a list, with staff able to handle bulk edits and multi-language conversion themselves.

Both screens above are ones we built and currently operate.

HOW IT WORKS

The Process Is Just 3 Steps

STEP 01

Operations Diagnosis

We review together the work you're currently doing through Excel, by hand, or over KakaoTalk.

STEP 02

Consulting · Custom Design · Quote

We design with only the modules you actually need, and provide a quote.

STEP 03

Build · Operate

We build it to fit your site and support you through stabilization.

Ask First
You Can Just Ask First Whether This Would Work for Your Site

It's fine if your requirements aren't fully defined yet. Just share the Excel template or workflow you currently use, and we'll first show you how a similar site solved the same problem.

ESTIMATE

Estimated Timeline & Cost

This varies by scale and scope of integration. The figures below are rough guidelines.

Are We Small-Scale?
If you just want to check one process first — like inventory lookup or stock movement
Or Mid-Scale?
If you want to see production status alongside inventory and warehouse, or need existing ERP integration
Or Large-Scale?
If you need to integrate multiple processes, equipment, and sites at once

We'll pin down the exact scale together during the operations diagnosis. If you're not sure, just reach out.

Small-Scale
Timeline: 2–4 weeks
From $7,500
Single-Process or Small-Scale System Build
Confirm Your Scale With an Operations Diagnosis
Mid-Scale
Timeline: 1–2 months
From $15,000
Multiple Processes, Data Integration, and Custom Feature Build
Confirm Your Scale With an Operations Diagnosis
Large-Scale
Timeline: 2+ months
From $37,000
Multi-Site, Multi-System Integration and Complex Workflow Build
Confirm Your Scale With an Operations Diagnosis

The actual quote depends on your site's processes, integration scope, number of users, and whether hardware is included. The figures above are a starting point for budgeting.

PROVEN ON SITE

Already Running at Large Enterprise Sites

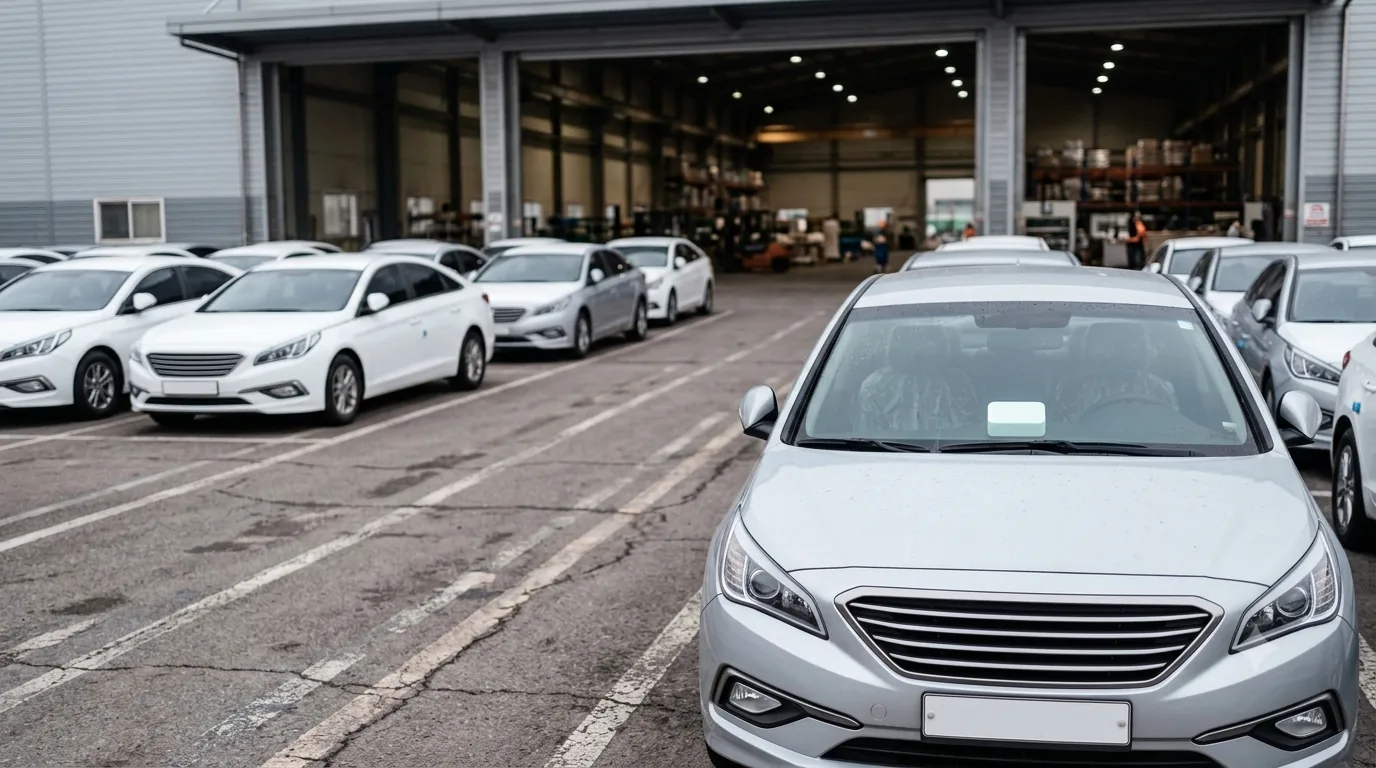
UWB system installed at an indoor-outdoor boundary, overlooking both the vehicle shipping yard and a warehouse loading door
Automotive Logistics (Company H)
Automotive Logistics Site

Real-Time Vehicle & Asset Tracking in the Yard

98% Reduction in Vehicle Search Time
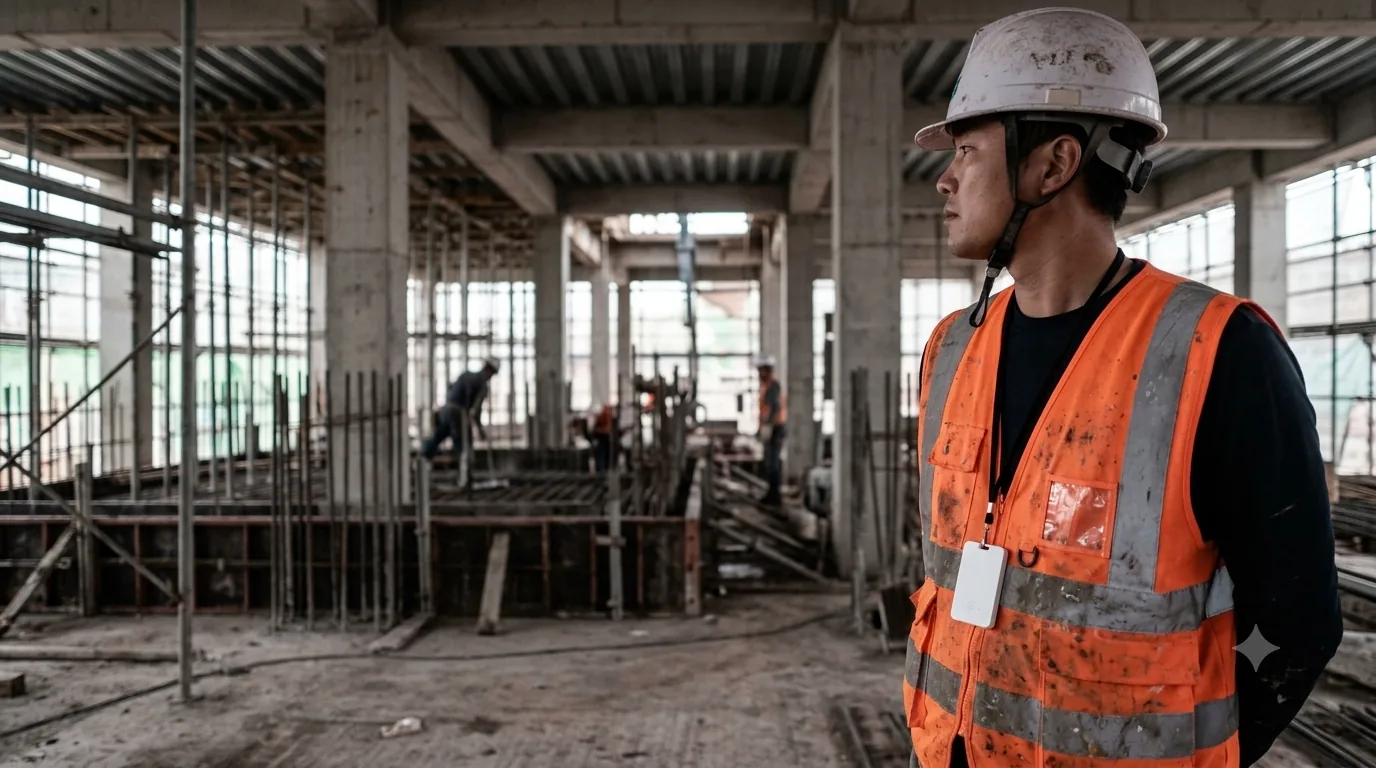
UWB personnel tag worn on a large construction site worker's safety vest
Major Construction Contractor
Large Construction Site

Worker Location & Hazard Zone Management

23.05cm Location Accuracy
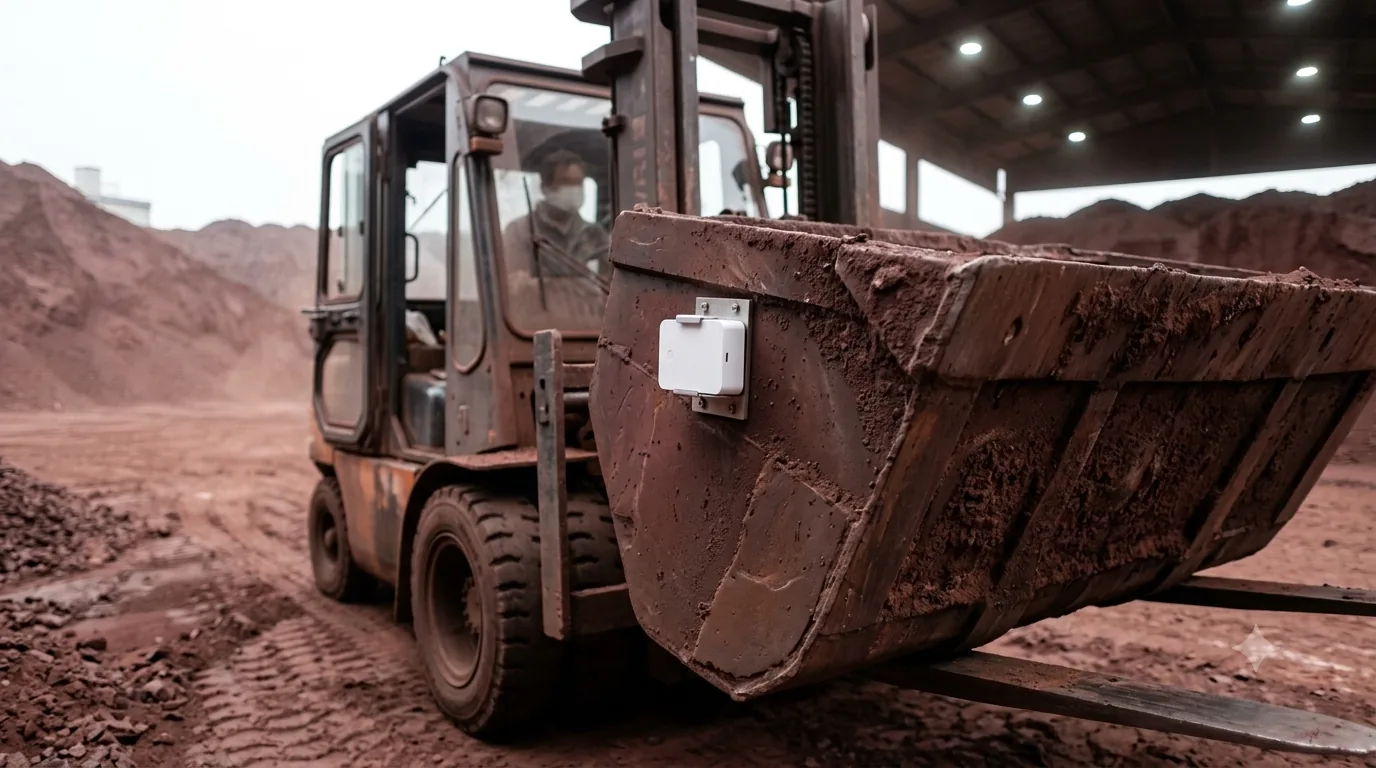
UWB asset tag attached to the side of a metal bucket being moved by a forklift in a steelworks raw-material yard
Major Steel Manufacturer
Steel Manufacturing Site

Unified Control of Forklift & Material Movement

7 Years
Founded
40+
Field Deployments
7
Patents Registered

※ Photos are example installation images based on actual GrowSpace products. The projects described are real cases.

TRACK RECORD

Numbers Built Up Over 7 Years in the Field

7Years
Manufacturing & Logistics Site System Builds
Not office software — we've built systems that attach directly to equipment and processes.
40+
Site Builds & Deployments
The number of projects actually running in manufacturing, logistics, and safety sites.
4 · 11
Government R&D Projects · Patents Held
Not licensed-in technology — technology we developed ourselves and hold the rights to.
23.05cm
Field-Measured Accuracy in a Metal-Dense Site
Measured at a vehicle shipping center, where radio signal interference is at its worst.

※ As of September 2026. Location accuracy is a field-measured value from a vehicle shipping center dense with metal structures, and will vary by site conditions.

FAQ

Frequently Asked Questions

Our process is a bit unusual — will this still work?
That's exactly why we start with a diagnosis and consulting. We select only the modules that fit your process, so you never have to force your work into a standard template.
What happens to the ERP or Excel data we're using now?
We don't discard it. We connect to your existing systems, forms, and data, and put the data you've already built up to direct use.
How long does it take?
As a baseline, small-scale projects take 2–4 weeks and mid-scale projects take 1–2 months. This varies by scale and integration scope; we confirm the exact schedule once we provide a quote after the diagnosis.
Are we guaranteed to get a government subsidy?
It depends on the specific program and your site's conditions. We'll check together whether your site qualifies during the operations diagnosis.
What about maintenance after the build?
We support you through stabilization and operation after the build. Specific terms are provided along with the quote.

Start With a Diagnosis of What Needs to Change

We review the work you’re currently doing through Excel, by hand, or over KakaoTalk, and select only what fits your process.

Information you submit is used only for consultation purposes.