
A flat map can't show floor or elevation. GrowSpace adds a Z-axis height value to X/Y coordinates so crane, equipment, and personnel positions can be viewed in real 3D space.
3D Coordinate Calculation & Visualization Architecture
The core technology behind this: adding a Z-axis (height) value to real-time position coordinates and aligning them with a 3D spatial model of the site for visualization.
※ Actual coordinate-alignment precision may vary depending on floor-plan data and installation conditions.
Adds a Z-axis (height) value to positioning results such as TDOA to produce true 3D coordinates instead of flat ones — capturing the position of vertically-moving assets such as crane hooks or elevated equipment.
Aligns the computed coordinates with a 3D spatial model built from floor plans and equipment layout. Matching the coordinate system to the site's actual floors, zones, and equipment positions gives the location data real spatial meaning.
Streams aligned 3D coordinates to the dashboard in real time. Filter by floor or zone to view only the range you need.
※ Considerations for Deployment
3D location data goes beyond simple display on a monitoring screen — it's integrated with the site's floor-plan and equipment data.
Streams live coordinates into a 3D viewer. Supports site-specific view configurations, including floor/zone filters and equipment-centered views.
Aligns the coordinate system of existing CAD floor plans and equipment-layout data with the location data. For new deployments, the coordinate system is set based on the site's floor plans.
3D Spatial Visualization by Positioning Method
When handling positions in multi-floor or vertical spaces, the limitations of each representation method should be considered.
| Spec | 2D Map Display | CCTV Visual Check | GrowSpace 3D Location Visualization |
|---|---|---|---|
| Elevation (Z-Axis) Display | Not possible (flat only) | Possible (camera-angle dependent) | Possible (coordinate-based) |
| Multi-Floor / Vertical Space Support | Requires switching between floor views | Blind spots occur | Unified view within a single 3D space |
| Real-Time Performance | Real-time (flat only) | Real-time, but requires continuous human observation | Real-time, with automatic coordinate updates |
| Deployment Complexity | Low | Low (camera install only) | Moderate (requires floor-plan alignment) |
Brings location data scattered across floors and elevations together into a single 3D space, so you can grasp the site at a glance.
See the Full Case StudyThe process of adding height information to flat coordinates to render the entire space in three dimensions.
Collects X, Y, Z coordinates from positioning results.
Aligns the coordinate system with floor-plan and equipment-layout data.
Reflects the aligned coordinates in the 3D spatial model.
Displays the result on the dashboard as a real-time 3D view.
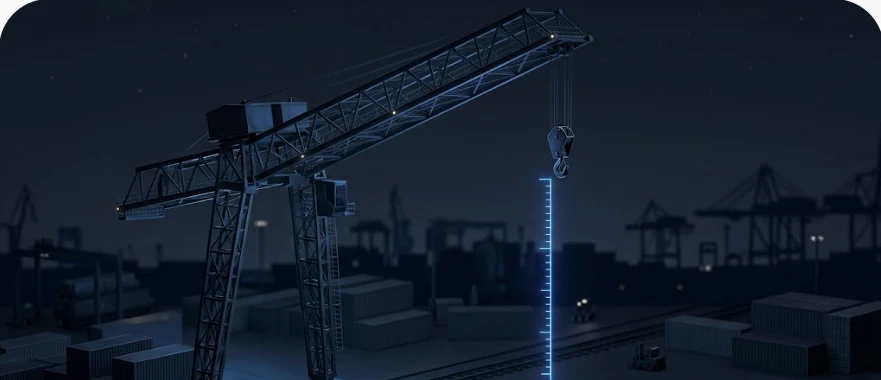 Crane Z-Axis
Displays the height and position of vertically-moving equipment, such as crane hooks at port and shipyard sites, in real-time 3D.
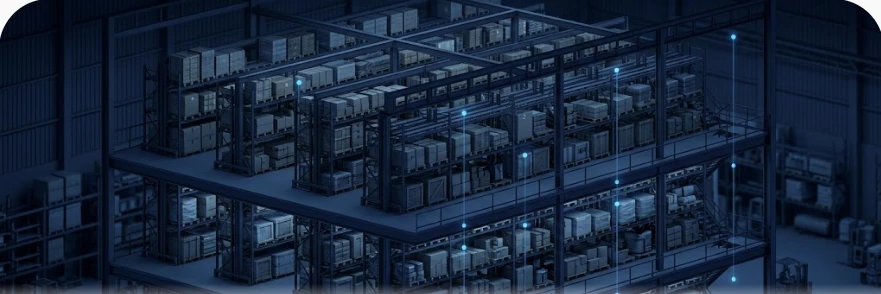 Multi-Level Warehouse
In warehouses with multi-tier racking or multiple floors, identifies which floor or zone an asset is located in using 3D space.
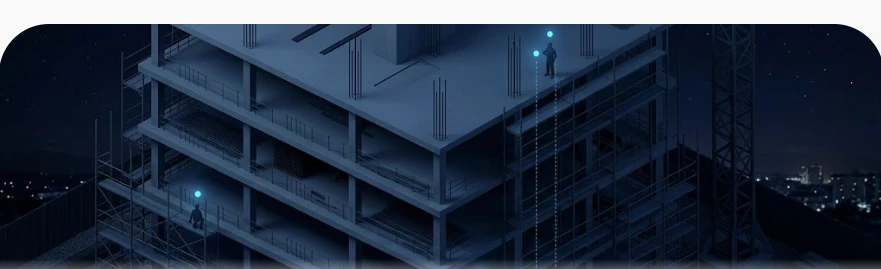 Height Work
Displays the floor and elevation of personnel working in elevated zones in 3D, giving an at-a-glance view of safety status.
See your site's height, not just its floor plan, with GrowSpace 3D Location Visualization.