

Set RTLS update-rate requirements by working backward from the decision that consumes the position. Write down how old the location may be, how many tags are active together and how the application will respond when updates are late. Then test the complete data path. The highest advertised rate alone cannot tell you whether a warehouse search screen, zone-event service or research application will work well.
This planning method separates workload arithmetic from verified product capacity. The numerical examples below are hypothetical, not Q1 benchmark results.
Define freshness at the point of use
A worker finding a stationary tool and a developer reconstructing a moving route have different information needs. Start with the consuming action rather than a request for “the fastest setting.”
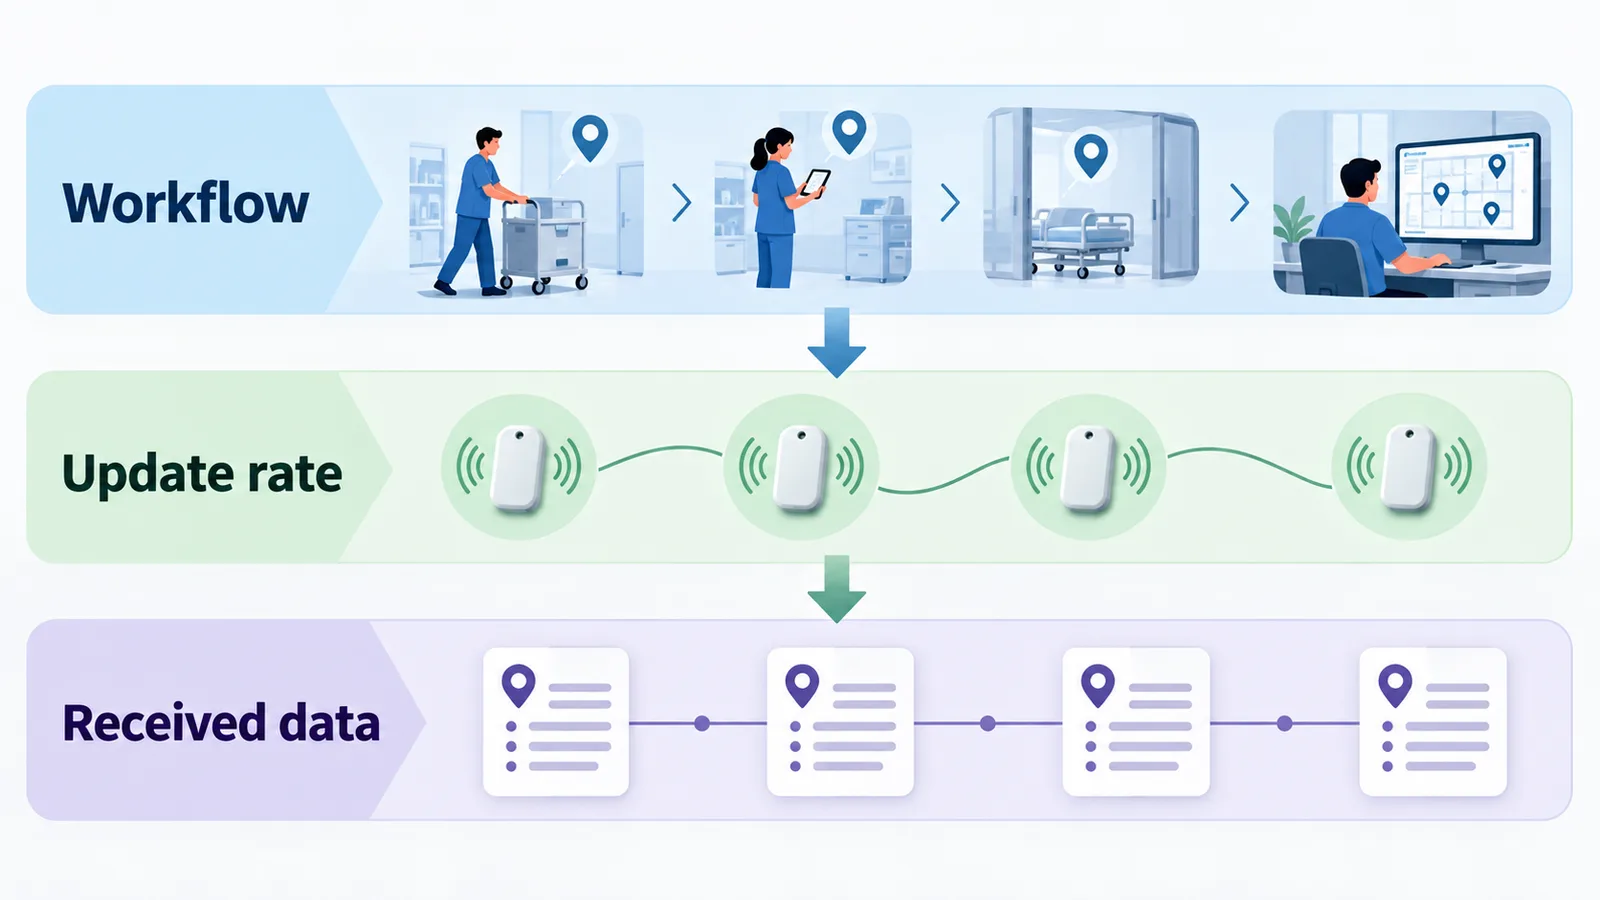
For each workflow, specify:
- Who or what consumes the position
- The decision made from it
- The acceptable age of the information at that decision
- The number of tags active at the same time
- Whether tags move continuously, intermittently or rarely
- What the application should do when freshness cannot be established
Describe the measurement point. An interval between messages at a server is different from the age of a coordinate when a user sees it. A screen can receive new messages while still showing old application state.
For business reporting, distinguish the frequency of location observations from the frequency of reports. Producing one shift report does not establish that a single location observation per shift is sufficient. Conversely, a frequently refreshed screen need not retain every intermediate observation indefinitely.
Keep four rates separate
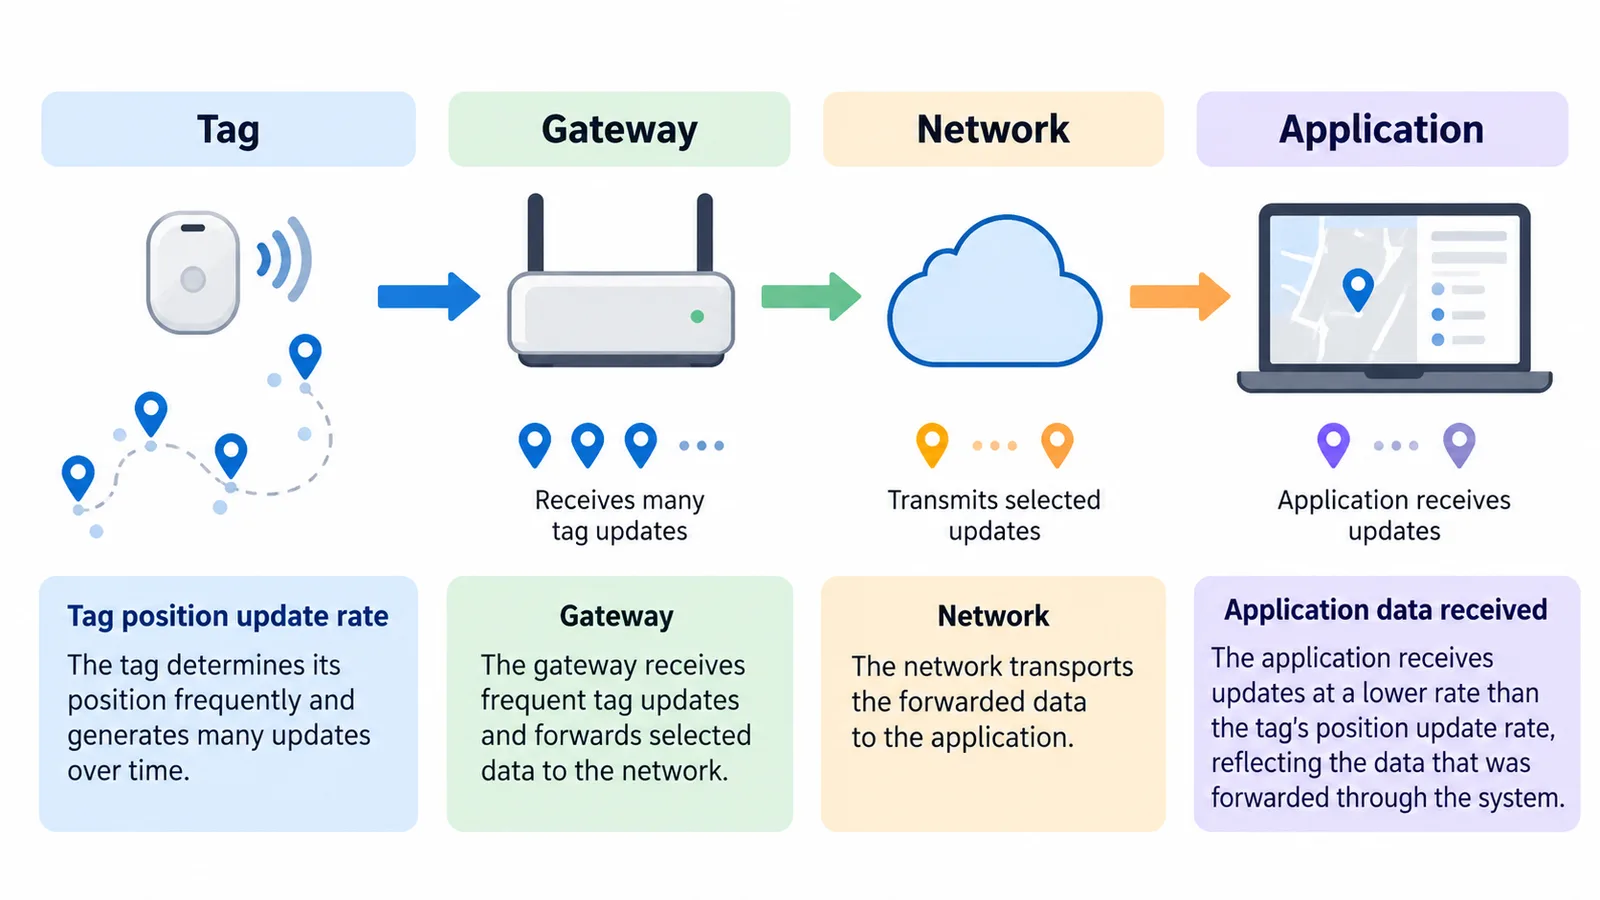
| Measurement | What it describes | What to verify |
|---|---|---|
| Position measurement or update rate | How frequently new position observations are produced | Exact device configuration and operating conditions |
| Delivered position-record rate | How many usable tag records reach the consumer | Gaps, bursts, batching and tag distribution |
| Transport message rate | How often messages arrive on the chosen data path | Records per message and actual message size |
| Application refresh or event rate | How often a screen changes or a business event is created | Processing, database and interface behavior |
A message can contain records for more than one tag. Therefore, a calculation in tag positions per second cannot automatically be labeled MQTT messages per second. Measure both in the intended integration.
Also distinguish frequency from latency. Frequent arrivals do not prove that the observations are recent. To measure end-to-end latency reliably, the design needs a verified observation time and an appropriate clock relationship. Receiver timestamps alone describe receipt.
Calculate an illustrative workload
Suppose a planning exercise includes two groups. These rates are assumptions for the example, not recommendations or confirmation that a Q1 configuration supports mixed rates.
| Hypothetical group | Active tags | Assumed updates per tag per second | Position records per second |
|---|---|---|---|
| Intermittently moved equipment | 20 | 2 | 40 |
| Objects in a movement experiment | 5 | 10 | 50 |
| Total | 25 | — | 90 |
The arithmetic is 20 × 2 + 5 × 10 = 90 position records per second. If all those records were retained continuously for eight hours, the application would receive 2,592,000 position records at the assumed rate.
That estimate helps a software team size a test. It does not include transport overhead, indexes, replicas or event tables, and it does not establish radio or gateway capacity. Estimate storage from the actual record representation, retention policy and measured database behavior.
Build a second scenario for the busiest plausible operating period. Consider tags that are normally inactive, a backlog of downstream work or a consumer that reconnects. Do not assume that a gateway will buffer and replay missed records; verify its actual behavior.
Use published Q1 figures as a starting point
The GrowSpace Q1 product page, checked on 6 October 2026, advertises 15 tags at 10 Hz and approximately 150 at 1 Hz. The Q1 FAQ describes a gateway processing figure of up to 150 transmissions per second.
These published figures are starting points for configuration discussions. Confirm the exact model, firmware and meaning of each limit before applying them to your workload. In particular, obtain agreement on whether a limit describes tag transmissions, individual position records or published messages. A matching multiplication result is not a capacity test.
Avoid extrapolating a straight-line limit to every rate, mixed-rate group or network arrangement. Likewise, do not infer a battery replacement interval from the chosen update rate alone; that requires the applicable tag specification and operating test.
Test per-tag behavior, not only the total
A high aggregate record count can conceal one tag that stops reporting. For a representative test, capture the configured tag count and rates, software versions, test duration, movement pattern and the relevant site conditions.
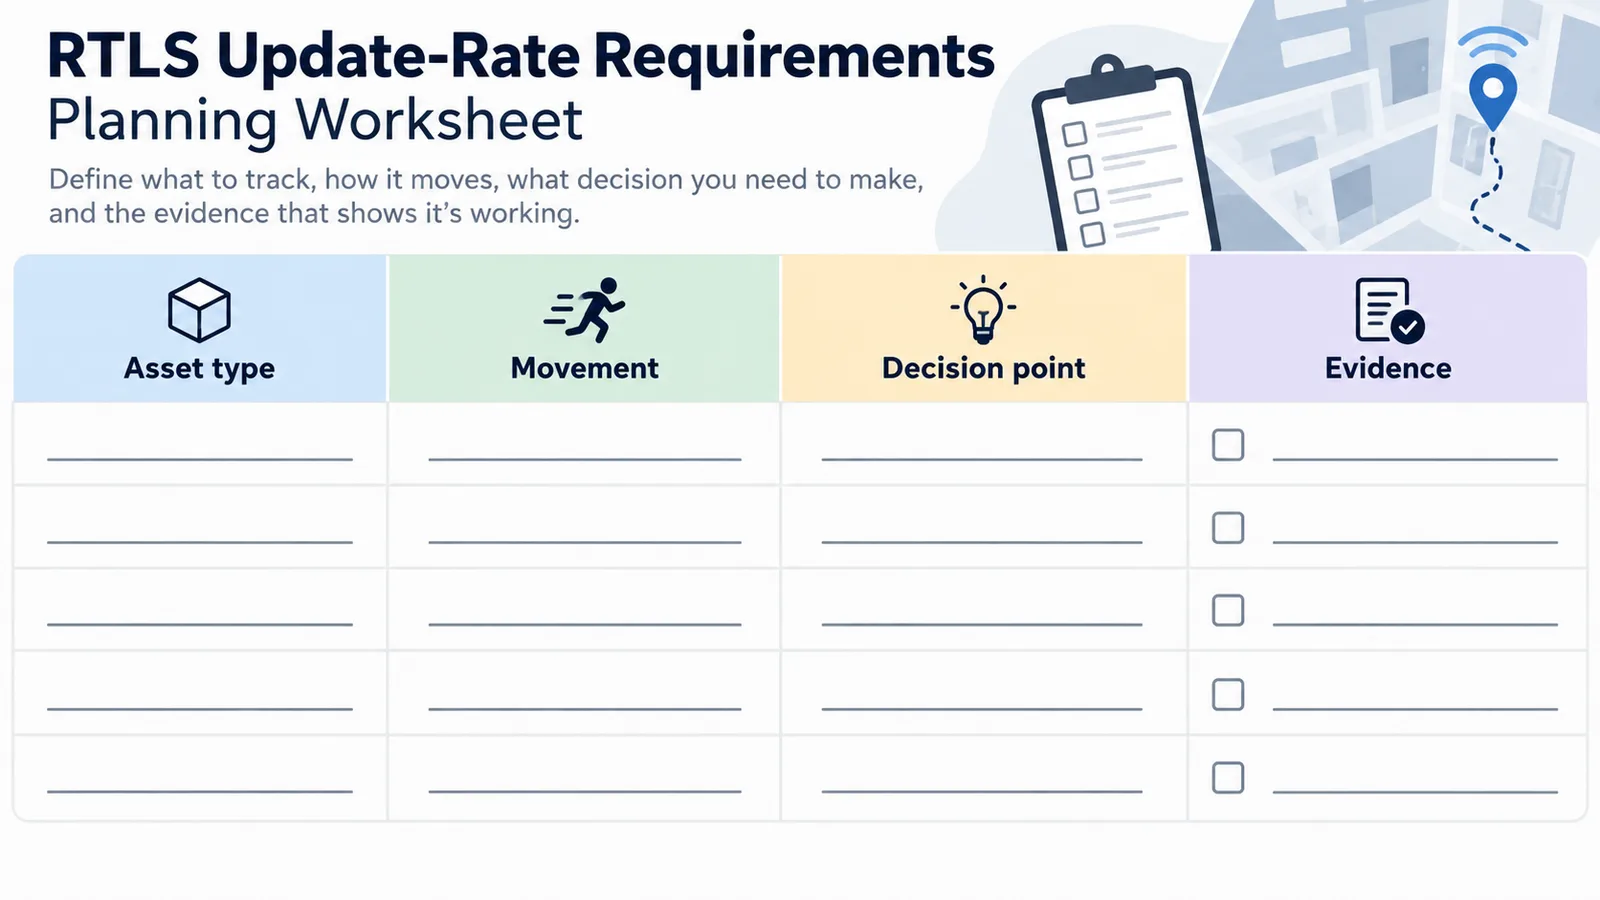
Measure:
- Per-tag arrival intervals. Record typical intervals, long gaps and how behavior changes during movement.
- Record validity. Count usable records separately from malformed, unknown or rejected records.
- Message behavior. Observe messages per second, records per message and bursts at the consumer.
- Consumer health. Check processing delay, queues, database writes and the age shown by the user interface.
- Incomplete evidence. If a verified sequence or timing reference is unavailable, report observed gaps rather than inventing an exact packet-loss percentage.
Run the application that will actually use the data. A terminal displaying coordinates is a useful baseline, but it does not test the production parser, identity mapping, persistence and screen together.
Turn the findings into an acceptance statement
A useful acceptance statement names the workload and the observed outcome: active tag group, operating area, test duration, defined freshness criterion, permitted gaps and the application’s stale-data behavior. Fill in the limits with the process owner and test team rather than copying generic values from an example.
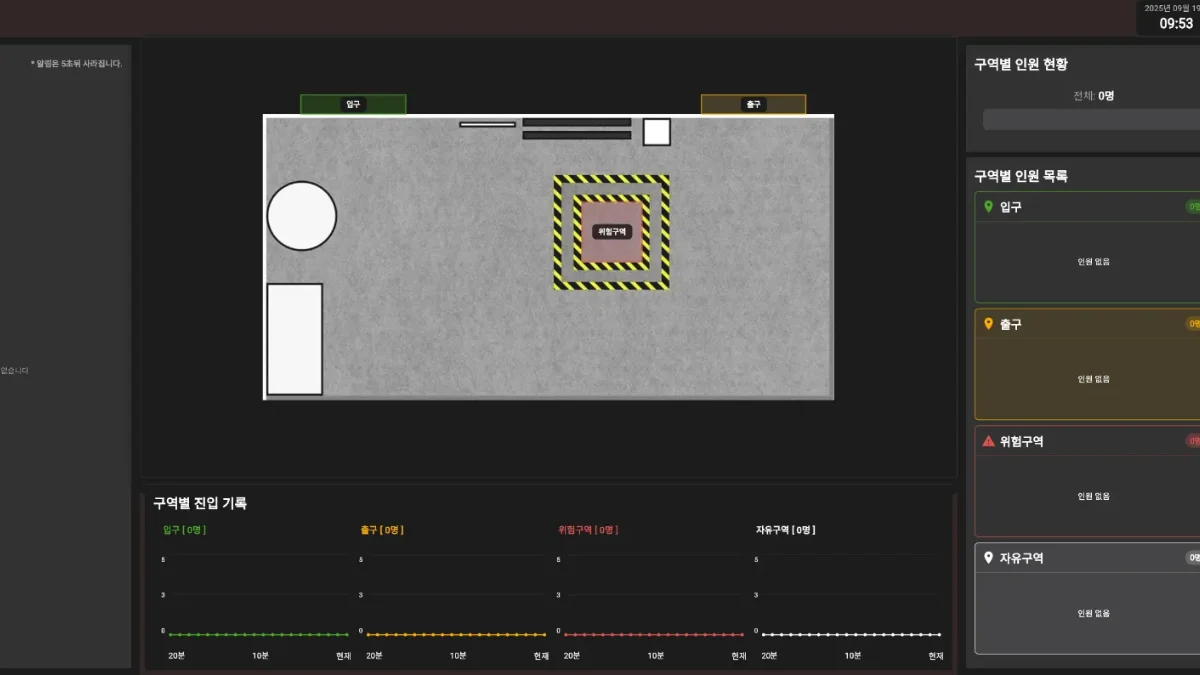
If the requirement is not met, the next step may be a lower workload, a different operating scope or a review of a slow downstream component. Increasing a configured rate will not resolve every source of delay.
Scoping a Q1 configuration? Send GrowSpace your data-rate requirements, including concurrent tag count, the required location age at the consumer and how you plan to measure it. Ask for the applicable model and firmware limits before committing to the test configuration.
Related posts
- Can RTLS Stay On-Premises? A Network and Data-Ownership Checklist for IT Teams
- Planning RTLS Integration with WMS or MES: Keep Tag and Asset Identity Connected
- Buying a UWB Kit for an Overseas Team: What to Include in Your RFQ
- Freegrow Selected for Regional Innovation Scale-Up Program by the Ministry of Science and ICT and the Innovation Cluster Foundation